
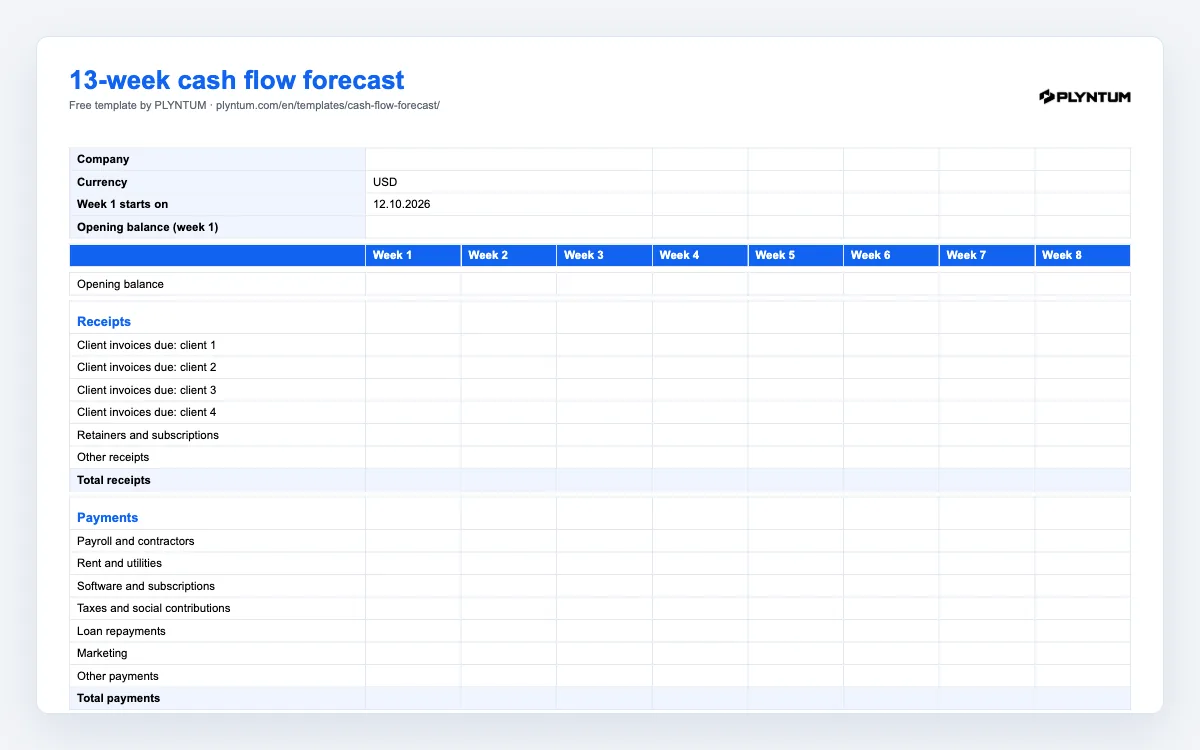
What is in the cash flow template
The file, plyntum-13-week-cash-flow-template.xlsx, has two sheets. Forecast is the one you keep:
- Header: company, currency, the Monday week 1 starts on, and the bank balance at that moment. The 13 week dates fill in from that Monday.
- Receipts: four client rows, one for retainers and subscriptions, one for other receipts, and a total per week.
- Payments: payroll and contractors, rent and utilities, software and subscriptions, taxes and social contributions, loan repayments, marketing, other, and a total.
- Net cash flow and closing balance for every week, each week’s closing balance carried into the next as the opening balance, a 13-week total column, and the lowest closing balance of the period. A week that closes below zero is highlighted in red.
How to use repeats the steps below inside the file. The workbook uses formulas only, with no macros, and opens in Excel, Google Sheets and Apple Numbers. Nothing you type is sent anywhere.
How to build your first forecast
- Start with the bank, not the invoices. Enter the balance you actually have on the Monday week 1 starts. Cash in the account, not receivables.
- Put each invoice in the week the money arrives. Not the week you send it. Use the due date, then your experience of how late that client pays; a client that is always ten days late goes ten days later.
- Enter the fixed payments first. Payroll in the week it is paid, rent, subscriptions and loan repayments in their weeks, taxes in the weeks they fall due. These rarely move, so they anchor the forecast.
- Round to the nearest hundred. Precision does not improve a forecast; being roughly right about every week does.
- Read the closing-balance row. A red week is a week to act on now, while there is still time to move a payment, chase an invoice or arrange a buffer.
- Update it every Monday. Replace week 1 with what actually happened, shift everything one column left, add a new week 13. Twenty minutes a week keeps the forecast true; a forecast nobody updates is a spreadsheet.
Why 13 weeks, and what to do with a red week
Why 13 weeks
A quarter is long enough to see a problem before it arrives and short enough to forecast week by week from real invoices and real payroll dates. Monthly forecasts hide the week in the middle of the month when payroll leaves before the big invoice lands. The reasoning is in the article on the 13-week cash flow.
What to do with a red week
- Move money in earlier: invoice on delivery instead of at month end, ask for a deposit on new projects, offer a small discount for early payment to the one client whose invoice fixes the week.
- Move money out later: agree a later date with a supplier before the due date, not after; split a large payment in two.
- Arrange the buffer before you need it: an overdraft or a credit line is cheap to arrange in a good month and expensive to ask for in a bad week.
The forecast does not create cash. It gives you the weeks of notice in which the three moves above are still possible.